Case Study
Introduction
Unilogs is an easy-to-deploy, reliable, and highly scalable log observability platform for distributed applications. It enables users to ship, transform, store, and visualize their logs without complex configuration using a self-hosted infrastructure.
Observability and Log Aggregation
To understand what a log observability platform is, we first need to understand observability. Observability is, in brief, the ability to observe the inner workings of a software system. This is especially important in the context of a distributed application, where various functions are spread across different devices, making it difficult to get a holistic picture of its inner workings.
For example, if a user experiences slow response times when ordering a pizza, there are several things that could be causing the delay:
- Network latency could be higher than normal
- The validation of the order on the front-end application could be unusually slow
- The backend server could be having difficulty connecting to the database
- The database could be slow in finding and updating the “customers” or “orders” table
- The geolocation microservice responsible for generating an ETA could be slow
- All of the above, but the delay is only noticeable or significant cumulatively
Pinpointing the issue would be much more difficult without looking at information at the level of the entire application. The information generated by the app is called “telemetry”, and there are 3 main types: metrics, traces, and logs. An “observability platform” refers to an application which ingests, stores, and queries telemetry, and a “log observability platform” refers specifically to an observability platform that focuses on logs only.
Each software system generates a large quantity of logs, a stream of detailed information occurring at each node of the system. This information is easy to under-utilize unless collected and shipped to a common observability platform which can aggregate, process, and store the log data. The data can then be analyzed to generate and display graphical reports. One such report might be of counts of the log level (i.e. of logs labeled as “info,” “warn,” or “error”), either by the total over time or by node/source. The user can drill down to the details of any particular part of that graph, even down to the level of the individual logs. In this way, the user trying to understand a complex bug can quickly identify where a spike in errors or warnings occurred, then view which sources were generating unusual amounts of those logs, and then examine the details in order to piece together the whole story.
The alternative is to skim every individual log file for information that seems important, and attempt to mentally piece together some coherent meaning based on this heuristic sampling. Not only is this manual approach time consuming, it’s also prone to human error. Even when done well, the data analyzed in this way is not collected and stored as a small part of an increasingly useful, central hub of information. Instead it is simply stored in the file system of each machine hosting any log-generating part of the distributed app, at least until such local storage becomes infeasible. As the scale and complexity of a distributed application increases, the need for a log observability platform grows alongside it.
The challenge of setting up such a platform increases as well. Logs come in a variety of formats, requiring the log aggregation process to parse and transform them into a common structure that can be analyzed in bulk. Additionally, the large quantity of logs generated by an app means that any sizable distributed application could overwhelm a monolithic solution relying on a single machine to host the platform. In order to handle the scale of log aggregation in a larger production system, the log observability platform needs to have its functional component parts distributed across several machines (or virtual machines). For the purposes of this case study, a “component” is defined as a logical part of the observability platform, separated by function and separately scalable according to how the increasing volume of the throughput impacts that part of the platform. When a “shipper” component is included, installed separately and independently from the observability platform, the shipper and platform can together be considered part of an “observability pipeline.”
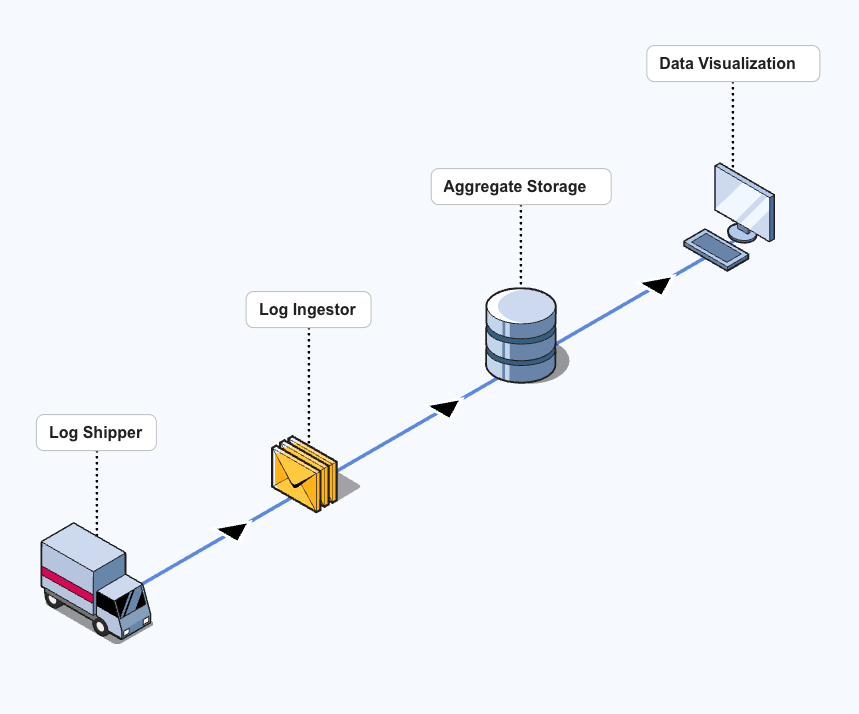
At a minimum, a log observability pipeline has 4 components:
- An agent aka shipper - Collects the logs and ships them to the ingestor. The shipper can also parse and transform the logs before sending them on, ensuring that they end up in a common format.
- An ingester - Receives the logs and inserts them into the storage component.
- Log storage component - Some type of database which keeps the increasingly massive stores of logs in long-term storage.
- Data visualization component - Queries and displays aggregate data about the logs–preferably with the ability to quickly drill down to the details of any particular log source or time period.
This design seems straightforward, but complications arise as the complexity of a distributed app increases, because each additional node in a distributed app is also another log source. As usage of the app increases, the rate of log generation for each source increases as well.
A single ingester could quickly become a bottleneck on the system, dropping logs and losing data as the sheer volume overwhelms it. This points to horizontal scaling for that component, but that isn’t simple, because log volume is bursty and unpredictable. Additionally, the storage itself quickly becomes a complex or expensive task–how do you handle collecting TBs of data every day without maxing out your storage capacity or paying an unreasonable amount to store it with a cloud service? Do you compress that data somehow? How can you efficiently query it?
For these reasons and more, existing observability pipelines are generally more sophisticated and complex than the simple model depicted above.
Existing Solutions
Existing observability platforms come in two main categories–managed services and self-hosted DIY setups. One kind of managed service is an end-to-end observability platform, like DataDog or New Relic. Another kind is a cloud-hosted, managed version of an otherwise open-source platform, like Grafana Cloud or Elastic Cloud, each of which is built using open-source components. Whether that’s the Grafana Loki stack or the “ELK” stack (Elasticsearch, Logstash, and Kibana), you pay for the cloud storage and for outsourcing the platform’s maintenance. These underlying stacks are also two of the main options in the DIY, self-hosted category.
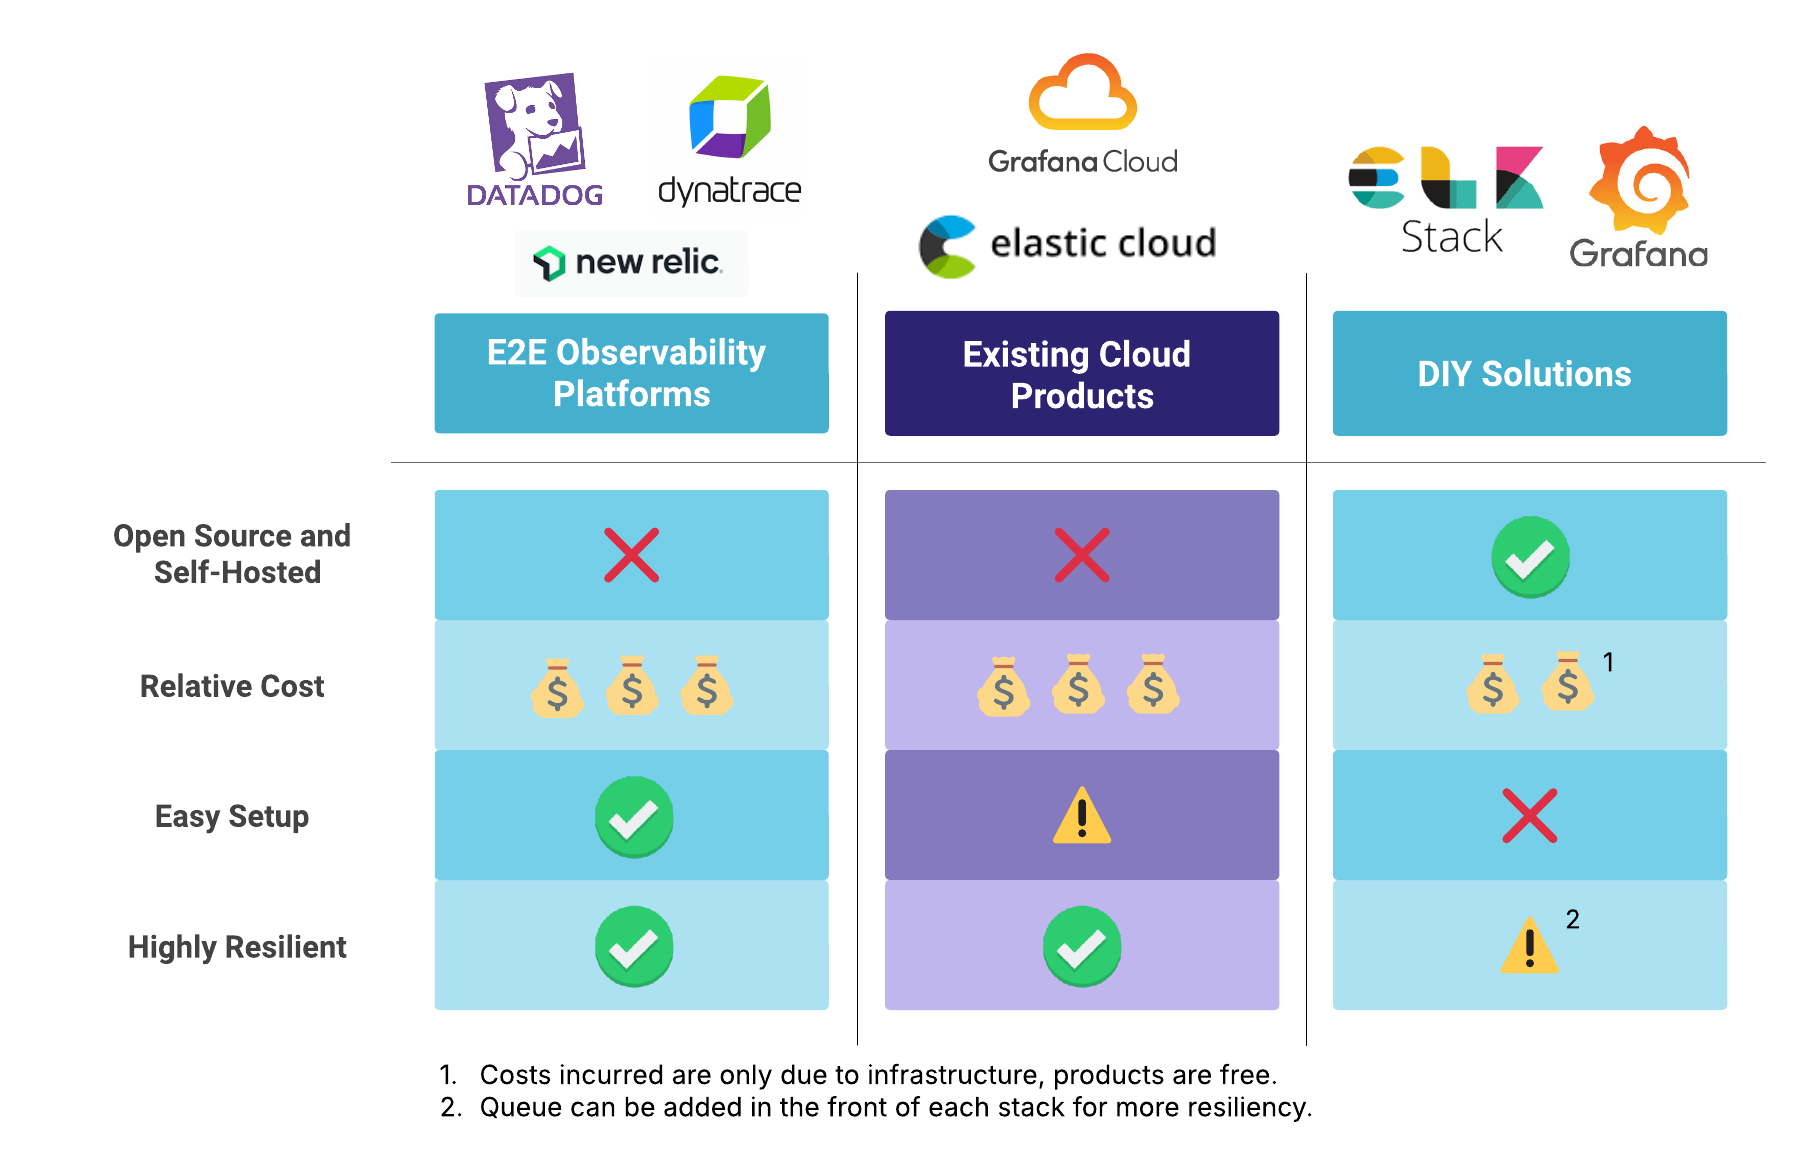
Each type of solution comes with its own advantages and disadvantages. The managed solutions are simpler to use, of course, but they also cost more. You’re paying for both the cost of the infrastructure and the cost of the service managing the platform. You also have to give up ownership of your data to use the service, which may not be a viable option if your app produces logs with sensitive or even legally protected data (e.g. personal medical information).
On the other hand, going the DIY route can entail weeks of overcoming configuration quirks and steep learning curves. The ELK stack is notoriously difficult, but even the Grafana Loki stack is complex–especially if you expand it to include additional components like a queue in front of the ingesters.
Time spent upfront on a DIY stack is an investment, but it’s also one which commits you to maintaining that complex system over time, both in terms of updating the infrastructure and scaling appropriately. Even when scaling has been handled in advance through the use of a container orchestration system like Kubernetes, it comes with its own steep learning curve.
Engineering time is money–but it’s also actually time, too. The need for an observability platform may become most obvious when there is already a problem for which insight is needed. But if an observability platform is being set up in response to a problem, spending a lot of time devising and building a DIY system would be prohibitively slow. Even if an observability pipeline is being built alongside a distributed application, that still slows down the work on what you actually care about–the application itself. A new pipeline is also more likely to change shape in terms of its infrastructure than an established one–which means any change to the log sources will entail another adjustment to the observability pipeline, possibly even cascading changes and/or configuration bugs.
Unilogs Solution
Unilogs provides both the performance of a highly scalable log observability platform and the convenience of a streamlined setup. The Unilogs platform is production-ready, capable of automatically scaling to handle ingesting several TBs of logs per day. It has the resilience necessary to handle large spikes in throughput and the reliability to avoid losing any valid data through the stateful data persistence of the Kafka distributed streaming platform. It has the flexibility of a self-hosted solution, and the cost is limited to the cost of its infrastructure. Unilogs is easy to use, but it’s not just a version of the naive log ingestion pipeline architecture described above–it is a powerful, production-ready system.
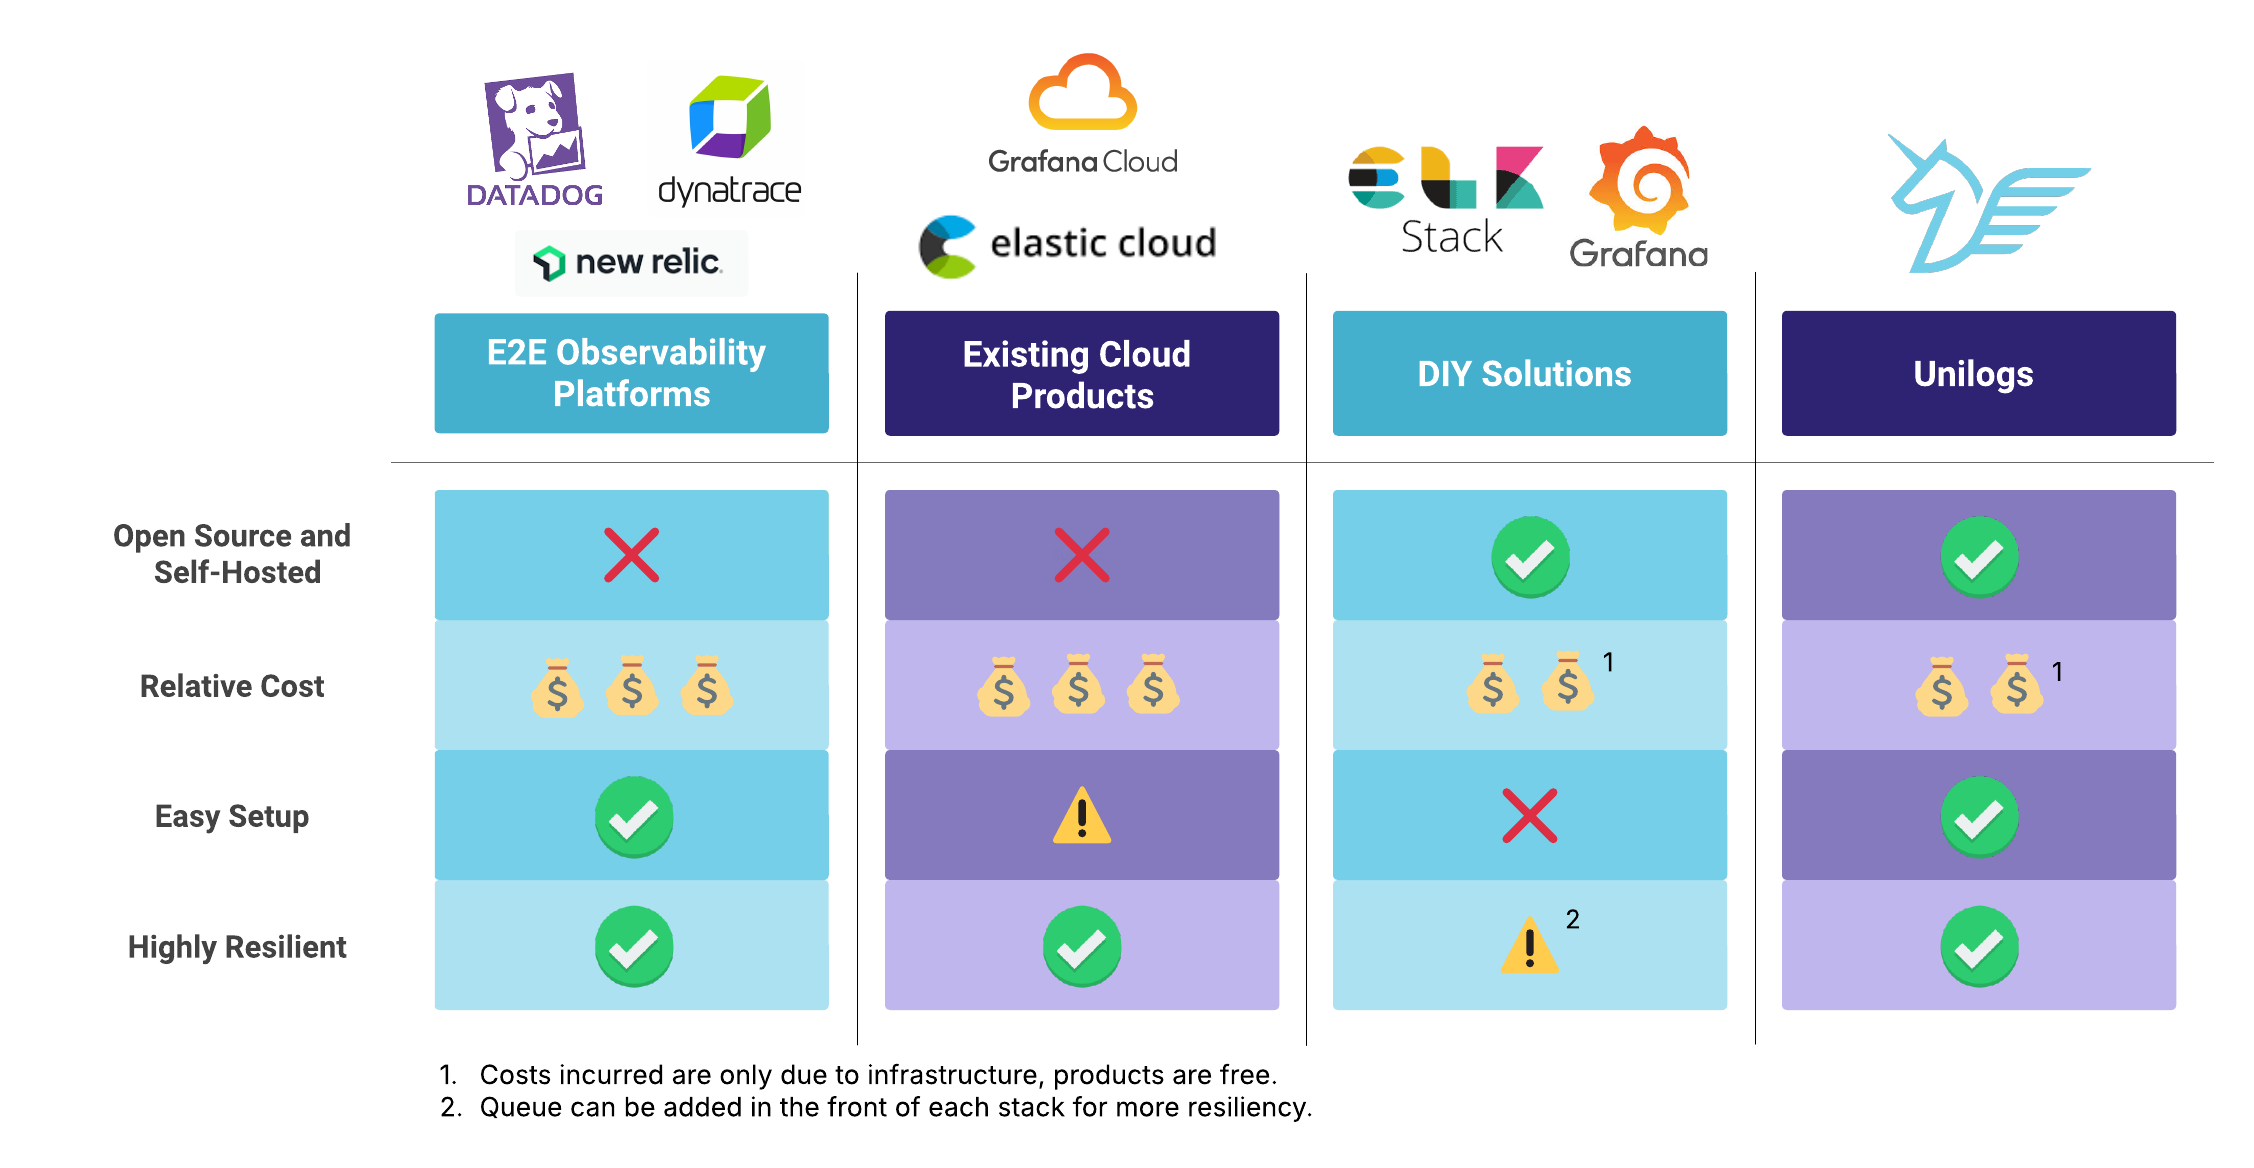
Unilogs combines key strengths of existing solutions: the ease of a managed service with the self-hosting and price point of a DIY solution. We focused on aggregating and analyzing logs, since they are the most ubiquitous type of telemetry. As an opinionated log observability platform, Unilogs comes pre-set with a particular infrastructure and a particular configuration. The Unilogs package comes with a set of Kafka message brokers in front, providing high reliability and resilience to the platform. Unilogs has a seamless setup, with a one-command deployment to AWS, the most popular cloud infrastructure provider.
That said, Unilogs would mainly be used because the engineers relying on it don’t already have the pre-existing expertise needed to quickly deploy a DIY stack. Our primary goal in building Unilogs was maximal simplicity for the user–but we were careful to ensure that this was at the cost of flexibility only, not at the cost of scalability or reliability.
The whole platform deploys with a single command and the provision of a few credentials. Instead of days or weeks, setup can be measured in minutes. There are only three prerequisites for deploying Unilogs:
- Node.js/npm installed on the machine that will do the deployment (generally already the case for a software engineer’s machine)
- Docker (and Node.js/npm) on any machine that will be setting up a log shipper
- An AWS account with an IAM user with admin or otherwise sufficient permissions (which would need to be the case even going the DIY route, assuming you were still deploying to AWS)
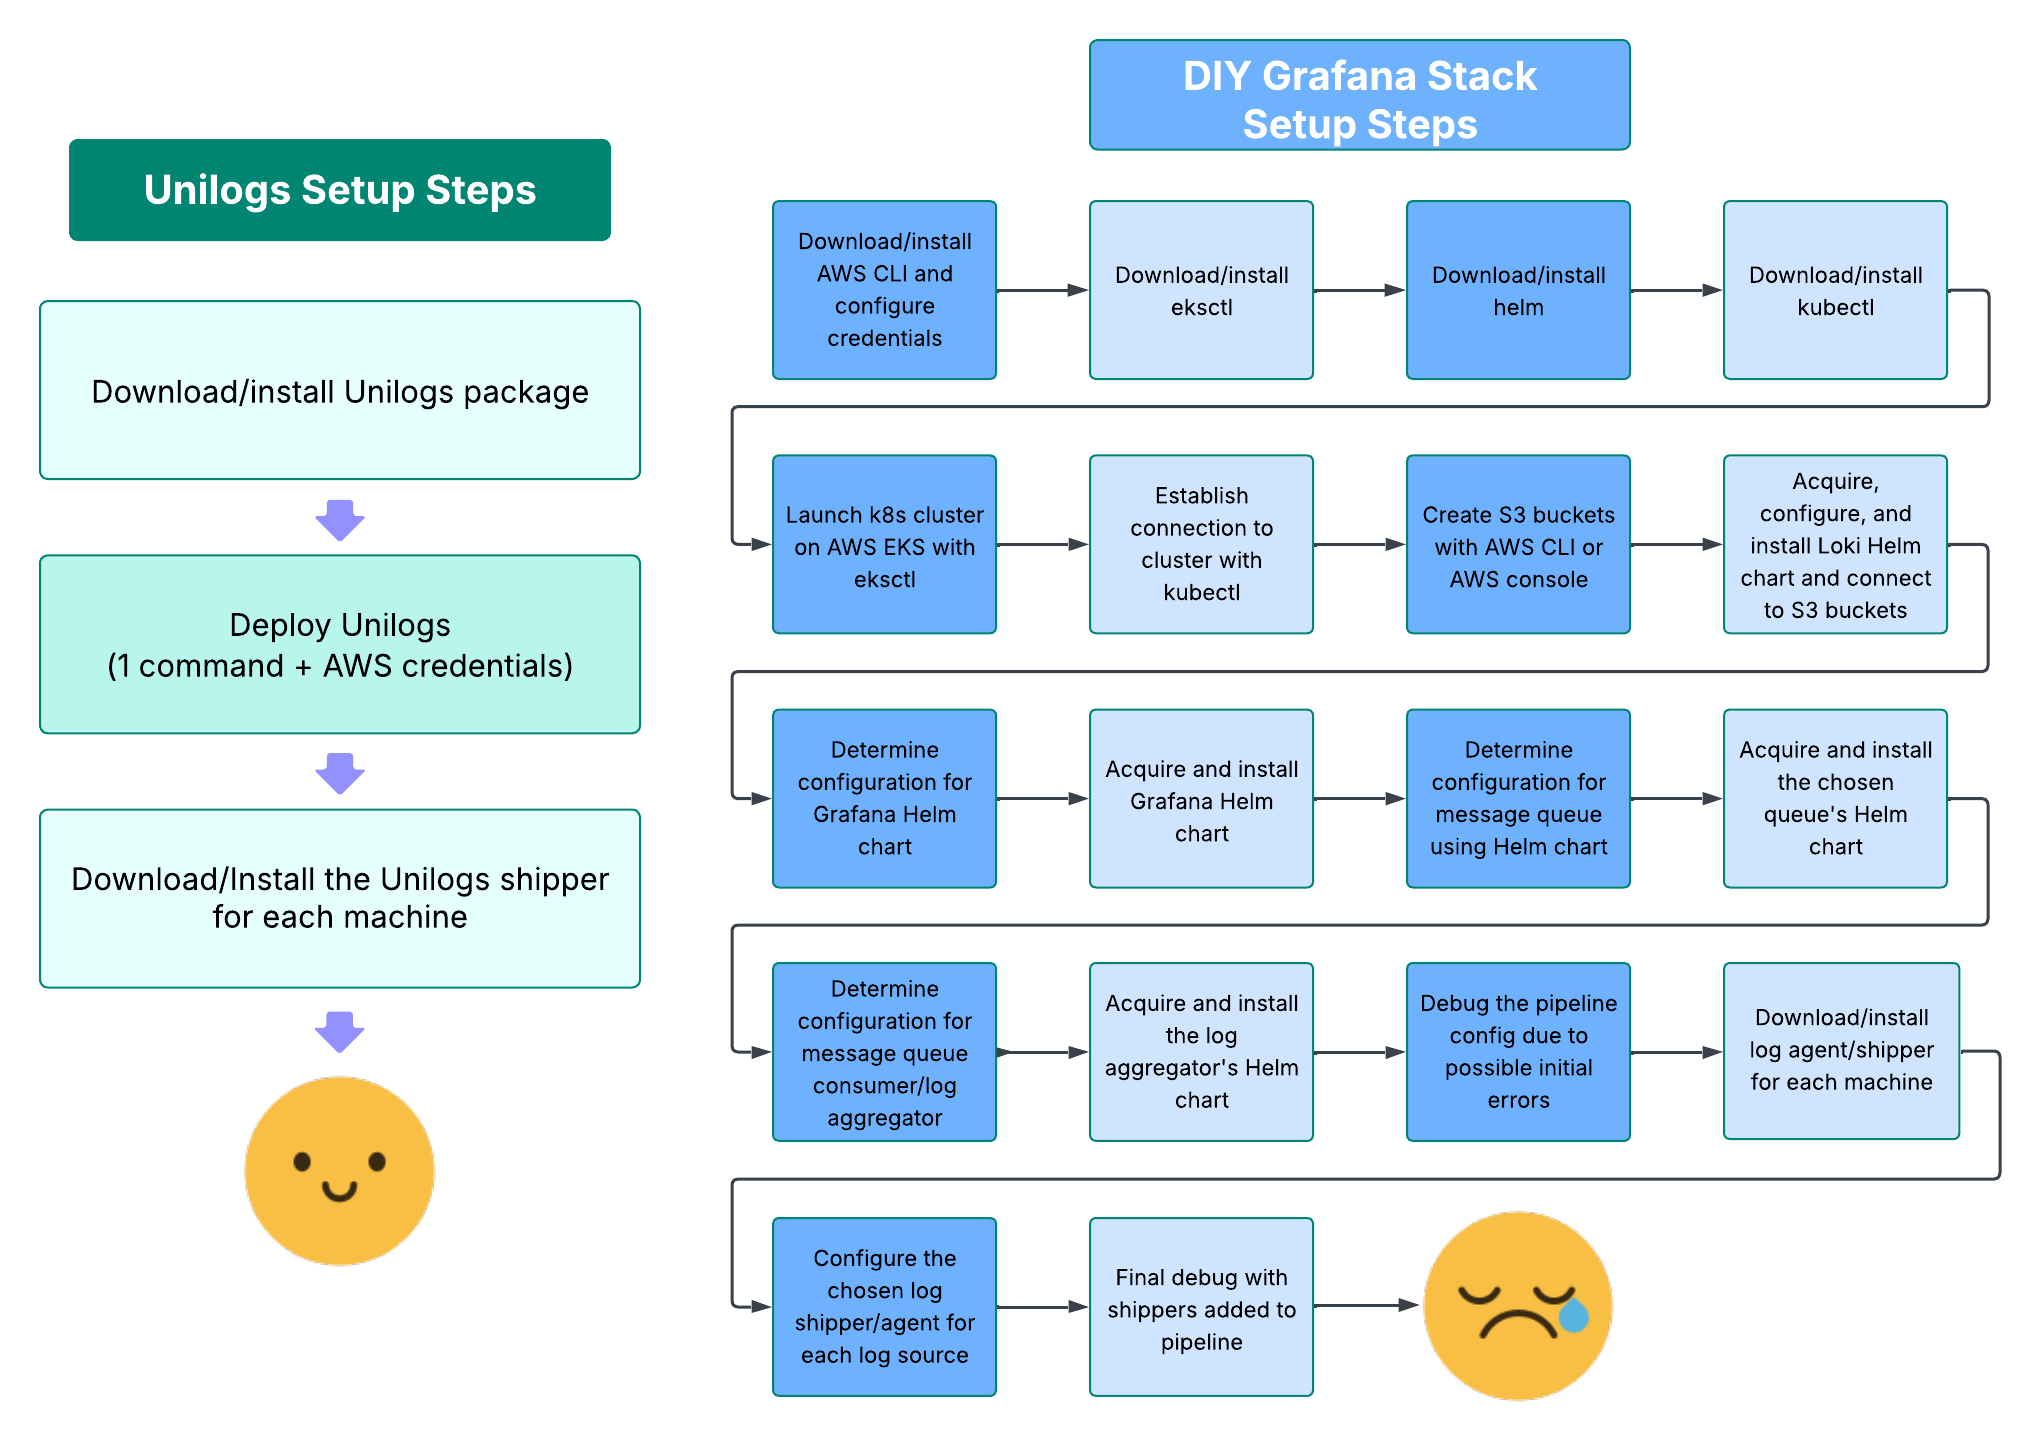
That painful-looking list on the right is avoided because Unilogs’ highly opinionated setup process enables us to pre-configure and automate away much of the complexity. This convenience comes at the cost of reduced flexibility, which manifests in a couple different ways.
First, our solution deploys to AWS specifically. You cannot deploy Unilogs to another cloud computing provider, and you cannot deploy to your own machines on-site. Given that AWS is by far the most popular cloud infrastructure service, and the fact that self-hosting with on-site machines is unusual and in most cases comparatively undesirable, we felt that this was a reasonable price to pay for the convenience of a largely pre-configured system.
Additionally, because Unilogs is a pre-packaged solution, it is also pre-built using specific components, and those components are configured to work together in a predetermined way. There is some limited flexibility, such as the option to use a different shipper than we provide, or the option to manually expand the configuration DIY-fashion to handle other types of telemetry beyond logs. But mostly, Unilogs does not have the flexibility of a fully DIY solution. As long as our setup used reliable, scalable architecture and reasonable default configurations, this seemed like a fair trade to make, since the users seeking a solution like Unilogs would likely not have the pre-existing expertise to have strong preferences on the choice of architecture and the configuration details.
To really understand the advantages of the Unilogs architecture and how it can reliably handle such high throughput, we’ll follow the journey of a log through the entire pipeline, from the log shipper to the Grafana UI.
Unilogs Architecture
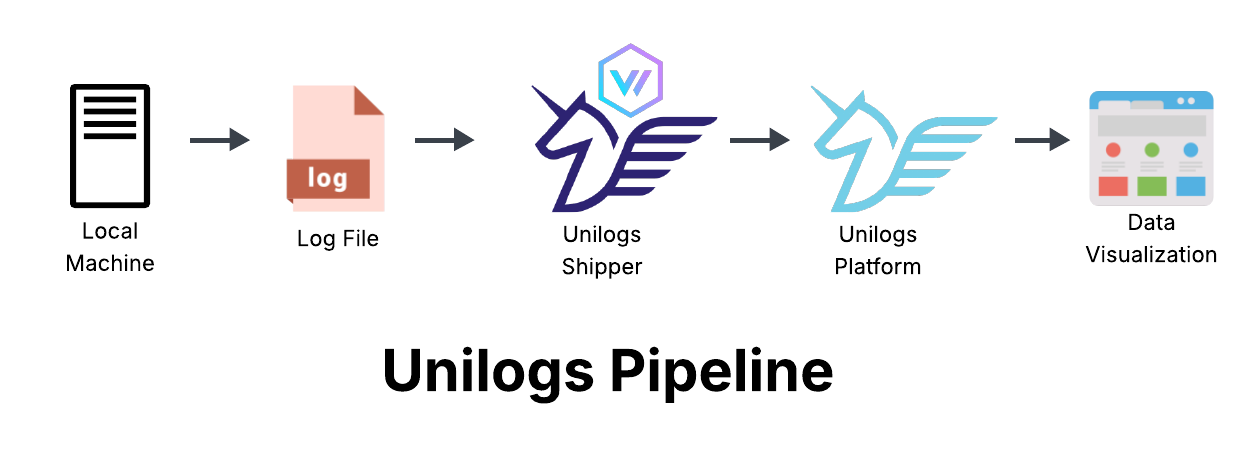
The beginning of the pipeline is the Unilogs shipper, which ships logs from the client’s host machines running parts of a distributed application. The main body of the pipeline is the Unilogs observability platform deployed on AWS, which ingests, processes, stores, and queries the log data. Finally, at the other end of the pipeline, Unilogs emits visualizations of the log data to the user’s browser when they sign into the Grafana front end. This high level view can be seen in the diagram below.
Unilogs Shipper - Vector
Distributed app nodes typically output logs to files. From there, a log shipper (aka an “agent”) is installed on the same machine so it can tail those log files and ship any new log entries somewhere. In Unilogs’ architecture, that log shipper is Vector. Vector is a newer, highly performant shipper which is very lightweight (only requires a few MB of memory)–a choice we made to avoid putting too much burden on the client’s host machines, since we don’t know how much spare memory they have to add something on top of the distributed app nodes running on those machines. Vector also has native TCP connectivity to Kafka, making it a good fit for our pipeline (i.e. we didn’t have to use a reverse proxy to first adapt HTTP messages).
Because this first step in the process occurs outside the deployed Unilogs platform, it was important to simplify the setup process for the shipper as well. For this reason, we built the Unilogs shipper configuration generator, a small node app that walks the user through the process of configuring and running a Dockerized container of Vector. The configuration generator runs on the command line, and simply asks for the user to point it to the path of the log file they want to ship, and to confirm the log format these logs are written in. If the log format is an unusual or custom format, Vector can still be DIY configured to parse those custom logs–but for the most common formats, the user can simply select it using our tool. The configuration generator can then install and run the Vector container, and begin shipping to the Unilogs observability platform.
See it in action below:
Unilogs Observability Platform
The main part of the Unilogs log observability pipeline is the Unilogs platform deployed on AWS. This is the part of the pipeline that does all the work–ingesting and aggregating the logs, processing them for storage, and querying and displaying log data visualizations. You can see in the diagram below that this is accomplished by several components working together to make a complete system, each of which is capable of scaling independently of the others as needed.
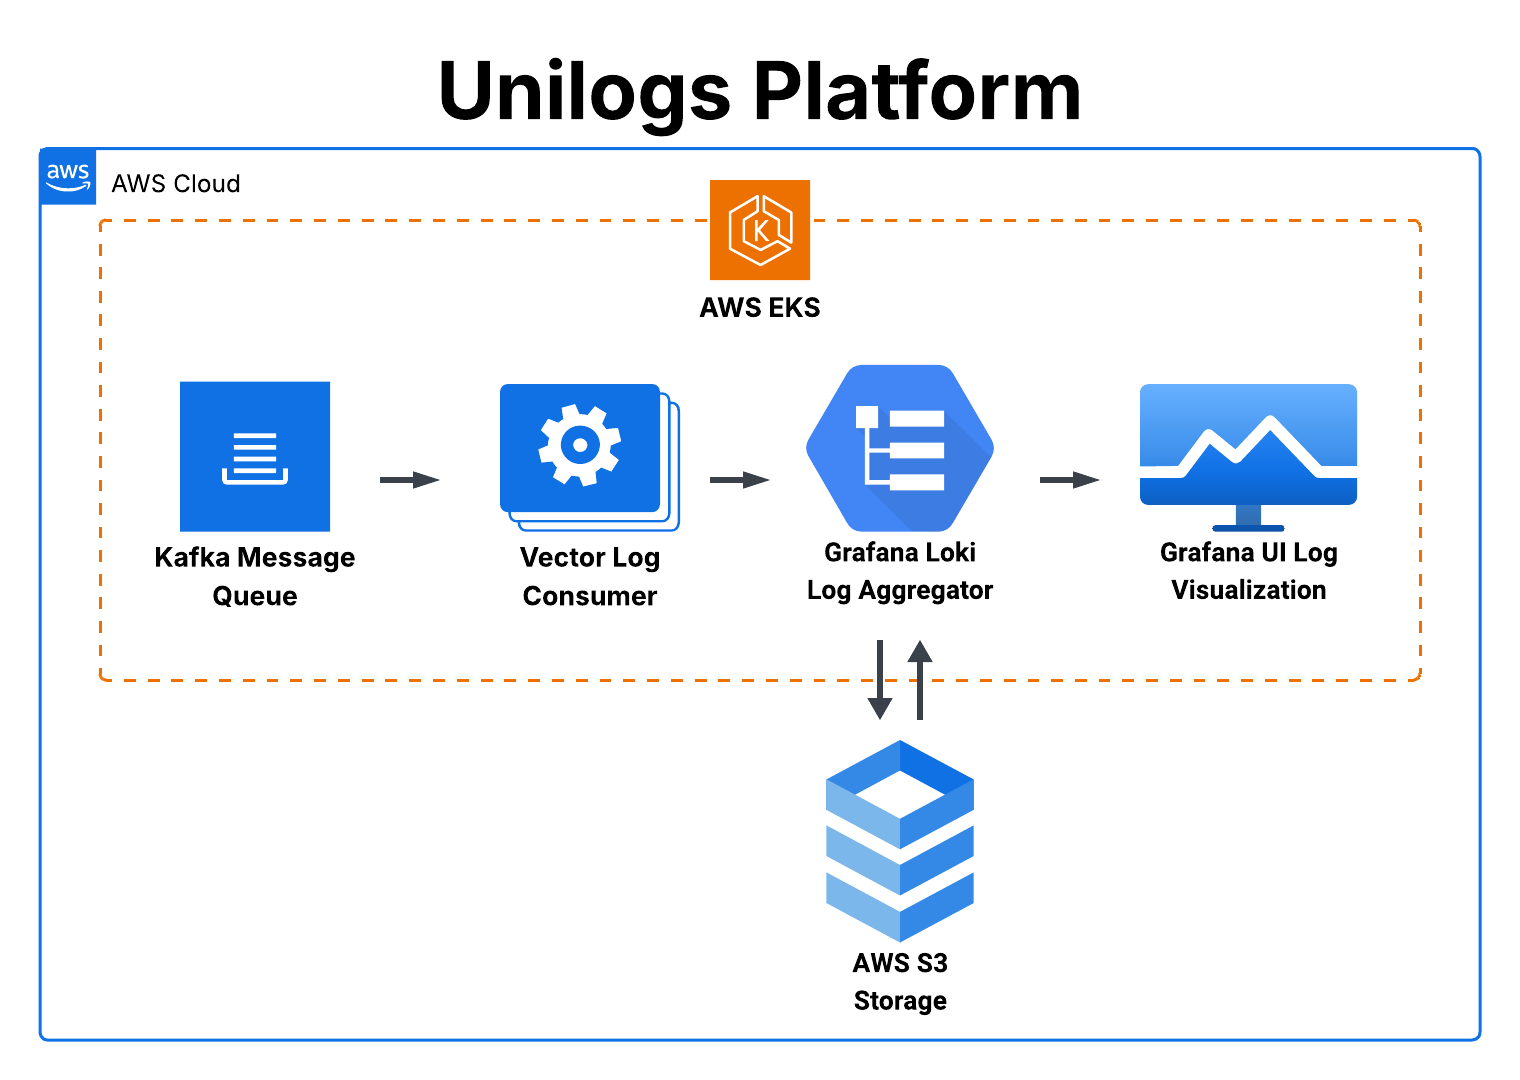
As shown above, the entire Unilogs platform is contained within a single Kubernetes cluster, hosted on AWS EKS. (Note: Grafana is included in the platform here because its backend is contained within the cluster, even though its front-end is client-rendered on the user’s browser.) Kubernetes is a container orchestration engine, and using it allows Unilogs to set up rules during deployment that determine how to automatically scale all parts of the infrastructure as needed to meet demand. At the level of the Kubernetes pods–networks of containerized functional components that make up Unilogs–this scaling is done both in terms of the number of replicas (horizontal scaling) and the portion of compute power allotted from the available total to each replica (vertical scaling). Additionally, the Kubernetes cluster is configured to automatically scale its worker nodes (horizontally), i.e. change the total available compute power from AWS that runs the Unilogs platform.
As we take a look at each major piece of Unilogs in turn, we’ll be able to see the ways that the tasks, capacity, and needs of each part of the platform differ, and how they all coordinate together using Kubernetes to form a highly scalable and reliable observability pipeline.
Unilogs Entry Point - Kafka
The first stop a log makes after being shipped to the Unilogs platform is Kafka, which serves as a queue in front of the rest of the log aggregation system. Placing a queue in front of a log aggregation system like Loki is a common way to resolve a common problem in log aggregation–bursts of high volume.
Pretty much every node of a distributed application will be generating frequent logs, and they all have to be stored somewhere. Depending on the size and type of the application, the volume of logs to ingest in total can be quite high, and that volume is increasing over time. A smaller business may measure daily log ingestion in GBs, but many larger businesses measure their daily log ingestion in TBs. Our choice of log aggregation system, Loki, is deployed in a mode that can handle several TBs of log data per day, which would be enough for many businesses with a moderately high log ingestion requirement.
However, logs are a bursty type of data. They are generated in response to events, so when an app is malfunctioning and throwing cascading errors, the output could multiply many times compared to the standard pace of log generation when the app is functioning normally. This is also when logs become most useful, since you’d want to be able to look into the details of what went wrong. So, even though our deployment of Loki can handle a large volume of logs, it’s still possible that a big burst of logs could overwhelm its log ingestion components. Thus, the need for some sort of queue that would allow for asynchronous log processing that doesn’t have to always match the pace of ingestion.
Like many others designing log observability platforms, we chose Kafka to function as our queue, although it is more than that. Kafka is typically described as a distributed streaming platform and message broker. It is a heavyweight component, often chosen for its high throughput (about 5TB/day per broker) and relatively low latency.
More than that, though, it is also a platform capable of storing and recovering large amounts of data, making use of data replication across brokers to ensure reliable delivery. Our Loki deployment may be able to scale automatically to handle large volumes, but large bursts of data could mean that a lot of logs get dropped due to Loki’s preset rate limiting (needed to avoid overwhelming the system) just when that data is needed the most.
The Unilogs platform deploys with three Kafka brokers, each of which manages its own partition of the total log data and replicates that data across the other brokers (for reliability). All in all, this means that Kafka enables Unilogs to sustain reliable data delivery even at peak loads.
On the other end of the Kafka queue, we again employ Vector–this time as a log “aggregator” rather than as an “agent”, i.e. it processes and forwards the logs taken from potentially multiple Kafka brokers, rather than collecting them from the machine it’s on. Vector workers are set to pull messages from any available Kafka broker and then process and forward them to Loki in the format it expects.
Unilogs Aggregation & Storage - Loki
When Loki receives a log from a Vector worker, it does more than simply store it. Loki is actually a complex log aggregation system, with eight different sub-components which can be split out entirely and managed as a web of microservices (for maximal scaling at the cost of significant maintenance), or even just lumped together into a single monolithic app (for a simple setup that can only handle about 20GB of logs per day). Between those two extremes, we have “simple scalable” mode, which logically groups these sub-components by broader functions into three main “targets” that translate into separately scaling groups of Kubernetes pods–read, write, and backend.
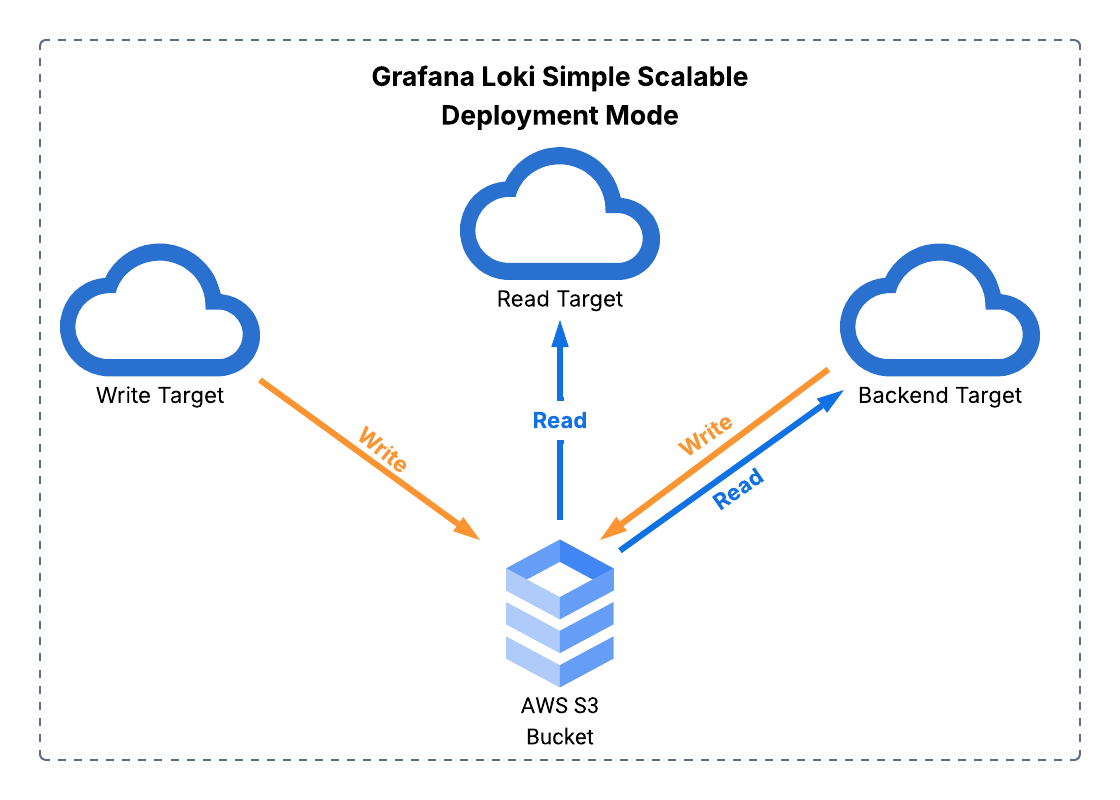
Unilogs deploys Loki in “simple scalable” mode to optimize between scalability and simplicity. This still entails a significantly more complicated setup than the monolithic version, but we abstract that away from the user in order to yield the benefits without this downside.
Part of the difference between the monolithic and the "simple scalable" deployment is that instead of simply storing the aggregate logs on its host machine’s file system, we need a common storage location that can be accessed by all of the read, write, and backend targets which is able to handle the massive scale of storage necessary to hold onto the log data.
For that, Unilogs configures Loki to use two AWS S3 buckets (an object storage service), one for the logs themselves and another to store indices that speed up querying. Loki works together with the S3 buckets to store, index, compress, manage, and query logs, ultimately retrieving this data for the final Unilogs component, Grafana.
Unilogs Querying & Visualization - Grafana
As just mentioned, Loki includes a sub-component (in its read targets) that queries the aggregated log data, but only when instructed to do so. The request for that data first originates from the data visualization component, which is responsible for handling requests from the user to display the retrieved log data in various ways. In the Unilogs architecture, this role is served by Grafana.
The Unilogs platform deployment automatically generates an external IP which the user can use to access Grafana’s UI. Once signed in with the user’s chosen credentials, they can customize the dashboard, make custom queries into the log data provisioned from Loki, and receive graphical reports.
The end result of the entire journey through the Unilogs pipeline, from the log file on the client’s host machine to the data visualization that comes out the other end, is the ability to meaningfully examine aggregate log data as well as drill down to any specific source or log of interest to see the preserved details–reliable log observability, even during peak bursts of activity.
Design Strategy and Technical Challenges
A repeated theme is the prioritization we placed on a simple user experience when deploying Unilogs, and the efforts we took to provide that while minimizing the trade-offs this decision entailed. The main method by which this was achieved was building Unilogs as a highly opinionated platform–almost all configuration is preset, minimizing the headache of deployment but also the user’s control over the details.
Unilogs does not prevent power users from making some of their own decisions and modifying Unilogs through some DIY work, but there are degrees of feasibility for these changes. Some of the opinions wrapped up in the Unilogs package can be adjusted after deployment using the AWS console and/or command line tools (e.g. by changing the scaling min/max of the platform’s underlying cloud compute or adding an AWS IAM role that other users can assume to get internal cluster access).
More difficult than post-hoc adjustments to deployment are some changes that would have to be made beforehand, such as by digging into our code and altering the configuration details for each component (Kafka, Vector, Loki, Grafana).
That said, we were less concerned about these more difficult adjustments, because our use case is users who don’t have the time to (or aren’t comfortable with) managing the configuration themselves, and who would benefit from those details being abstracted away by the Unilogs deployment package.
This approach, however, entailed one major challenge for us–in order for Unilogs users to do things the easy way, we as developers had to do things the hard way.
The Challenge of Writing Unilogs' Infrastructure as Code
The AWS CDK is a way to write “infrastructure as code”–your code should specify what pieces of infrastructure will be deployed, how they are configured to work individually and in concert, what permissions and resources they each have, etc., and then you can run a couple commands in the terminal to execute that deployment based on the code in your files.
This is easier said than done. The AWS CDK documentation is spotty, sometimes inaccurate, and occasionally out of date. “How-to” guides on AWS generally give instructions using the AWS console and/or using AWS command line tools like eksctl and the AWS CLI (combined with other command line tools specific to Kubernetes, like helm and kubectl), and have no guidance on how to accomplish these various critical tasks using the CDK. Multiple times we found a recent feature that seemed like it would be a huge benefit, tried to implement it, and ultimately realized it was impossible using the CDK. One prime example is “EKS Auto Mode”, which promises to abstract away the complexity of managing an EKS cluster’s security configuration, permissions, storage, and scaling details. This would have simplified much of our work, but the latest stable version of the CDK just didn’t have any functionality relating to that feature. (Perhaps a future version of Unilogs could make use of it with the next version of the CDK.)
Or sometimes, even worse, the feature could be partially incorporated into the CDK, but in a way that subtly conflicts with other CDK functionality and breaks your code. This was the case with the recent “Pod Identity” method of granting permissions to cluster addons, which is meant to streamline the old process. But because attempting to use the new authorization process created duplicate service accounts, breaking the whole deployment, we ended up reverting to the older, more complicated “IAM Roles for Service Accounts” (IRSA) method.
Each of the command line tools we cut out of our process were created for a reason–they reduce the number of steps it takes to do something, or even accomplish things the CDK simply can’t. These tools abstract steps away from the user, often performing prerequisite tasks without the user even learning that there were any. And, of course, the use of these tools was better documented, with step-by-step guides available for each critical task we researched.
So why did we choose to implement Unilogs deployment using only the CDK? The goal was to remove prerequisites from the process of deploying Unilogs (recall the diagram earlier comparing our deployment steps with those of a DIY process). With Unilogs, the user doesn’t need to install Helm, kubectl, eksctl, or the AWS CLI, and they therefore also don’t need to execute any extra manual commands using those tools or copy and paste a bunch of configuration details. All these steps would be eliminated as long as we could complete the process entirely using the CDK, which is what we ultimately managed to do.
The AWS CDK is not a user-friendly node package. But, in the end, it is what allowed us to make Unilogs user-friendly.
Reflections and Future Work
In keeping with the simplicity-first principle discussed above, for future work we would like to add support for more options for users, as long as that doesn’t result in shifting more of the configuration burden onto them. This would cut down on the trade-off of a less flexible deployment, the main cost paid by prioritizing simplicity.
For example, the Unilogs platform could be expanded to process metrics and traces, two other key pieces of telemetry that would build Unilogs into a more complete observability platform. As mentioned when discussing our architecture, we chose Vector as a shipper and Kafka consumer in part because it is capable of transmitting metrics and traces in addition to logs. It would take significantly more setup, and involve instrumenting the user’s applications on their host machines, but it could be done without changing our core architecture.
There are also smaller pieces of functionality that would be valuable to add in the future. As mentioned in the design decisions section above, users could alter the way permissions are granted to enable more users to access the Unilogs cluster through an IAM role, but this is not currently something we provide support for. However, we could provide options in the initial deployment process that would allow users to set this up from the start, either in addition to or instead of granting admin access to the deploying user.
One more ambitious expansion we considered was enabling multi-cloud support using Terraform–a cloud-agnostic provisioning tool which would allow us to write deployment scripts for multiple cloud destinations. Instead of limiting our users to AWS, we could allow them to select between AWS and any other cloud providers we’ve added support for (e.g. Azure). This was a lower priority for us, though, because AWS is by far the most popular cloud infrastructure provider.
¹https://devops.com/harnessing-the-value-of-log-data-analytics/
²https://grafana.com/docs/loki/latest/get-started/deployment-modes/#simple-scalable
³https://www.confluent.io/blog/kafka-fastest-messaging-system/